Physical Protection of Critical Infrastructures
The safety of critical infrastructures is one of the themes APEX solutions addresses. We are particularly interested in modeling physical protection systems and optimizing the response of protection teams to intrusion attempts, as part of our in-house EPIC (Evaluation of Critical Infrastructure Protection) project.
This work is carried out through the in-house R&D project EPIC (Evaluation of Critical Infrastructure Protection), which has several focuses:
identify possible targets of attack within the infrastructure,
- facilitate the semi-automatic elaboration of attack scenarios,
- define a typology of attackers (motivation, equipment, knowledge of the site),
- model the various detection and protection systems,
- automatically assess vulnerabilities,
- suggest improvements to increase the probability of interrupting the attack.
The analysis of physical protection systems was theorized in the 1970s/1980s in the USA, with most approaches stemming from the work of Sandia National Laboratories. Garcia, 2006 and 2008 offer a comprehensive overview of the subject. Infrastructure safety against intrusion is seen as a race against time between the attackers (red force) and the guardians of the infrastructure (blue force).
The red team’s goal is to complete its mission (sabotage, theft, etc.) before being intercepted by the blue team. Conversely, the purpose of organizing the physical protection system is to detect the attackers as early as possible and effectively delay them, giving the blue team enough time to intercept them.
The verbs that define the objectives of physical protection are the “4Ds”:
- DETER,
- DETECT,
- DELAY and
- DENY/DEFEAT.
APEX solutions has theorized attackers’ objectives using other verbs, the “4Ps”:
- PLAN,
- PENETRATE/PROGRESS,
- PERPETRATE and
- PUSH OFF, except of course in the case of suicide attacks…
Modeling Physical Protection Systems: Take it EASI!
The EASI (Estimate of Adversary Sequence Interruption) method is used as the basis for all approaches to modeling physical protection systems. Without going into detail, EASI links the time taken by the red force to carry out obstacle-crossing actions (which depends on the material it has carried away) and the time taken for the blue force to intervene (assumed to be constant), for a given attack path. Each delay is specified by its mean and standard deviation, and the method finally calculates an interruption probability, i.e. the probability that the blue team will manage to intercept the red team before the end of its action.
For a complete analysis, the EASI method must be applied to all possible paths (their determination being more or less automated according to different published methods) to determine the most vulnerable path(s), and consequently determine any improvements to be made to the physical protection system (adding detectors, reinforcing obstacles, reducing the response time of guards…).
Anticipating Attackers’ Movements and Determining Intrusion Paths
Unlike the marine saying about wine “red on red, nothing moves”[1], analyzing a physical protection system relies on the ability to anticipate the movements of the red force:
- the path that will be followed from outside the site to the attack target,
- the time required for each move,
- the time required to get past the protective devices.
The first two points depend on the attackers’ knowledge of the site: basic knowledge (exterior volume of buildings, the route is defined as the attack progresses), intermediate knowledge (organization of the rooms) or advanced knowledge (information on detection and protection devices).
The last point also depends on site familiarity and, more importantly, on the equipment available to overcome the means of protection (fence, armored door, etc.):
- by force: hand tools, power tools, thermal lance, explosives…
- stealth: badge to unlock some accesses, cyber attack before or during intrusion to unlock some accesses and/or avoid detection…
- with internal complicity (door or window intentionally left open, etc.).
The manual determination of all possible access paths to a realistic site, made up of different buildings with several rooms and surrounded by a perimeter wall, becomes very complex.
Éliette’s Contribution to Modeling Intrusions into Critical Infrastructures
APEX solutions approached ITM Alès with a proposal for an internship on the topic of critical infrastructure protection, which was chosen by Éliette Freychet.
The main objective of the internship was the automatic determination of all attack paths and their encryption according to different criteria, in order to determine a critical path (i.e. the most favorable path for attackers, minimizing travel time, probability of detection or probability of interruption).
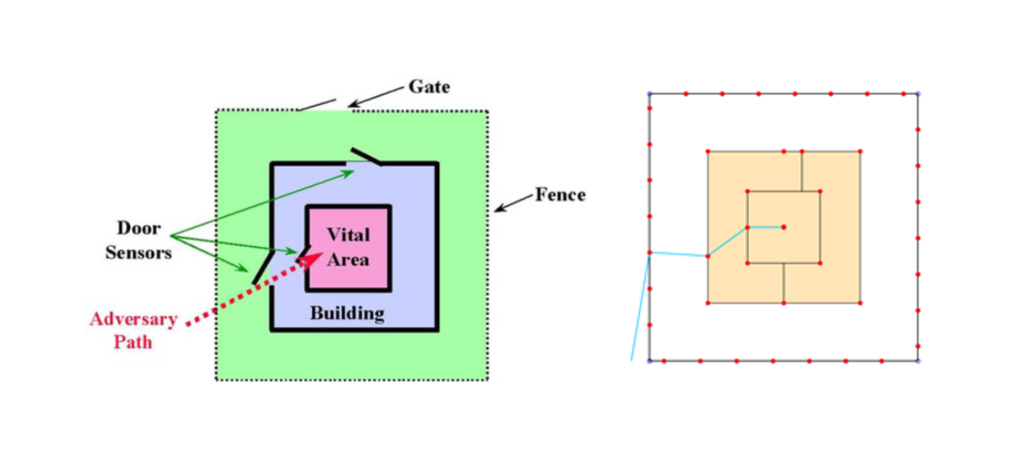
A theorem shows that the shortest path (in length or time) in a 2D environment with obstacles must pass through the edges of a mathematical object called a “visibility graph”[2]. In this graph, the nodes are formed by the contour points of the polygons[3] (some of them, and more importantly, the possible points of passage: doors and windows) and the edges connect the nodes that are visible in pairs.
Éliette worked on cases of increasing complexity:
- a single room of any shape,
- a room with an inner patio,
- several rooms forming a building,
- a multi-room building with a fenced-in enclosure.
In all cases, the code automatically determines the visibility graph, which will support the movements of the red force. Once built, this graph is weighted: travel times are calculated for each arc, along with detection probabilities. The red team can therefore follow a path that minimizes the travel time, or a path that minimizes the probability of detection…
The code then applies the EASI method to each of the identified paths leading to the room targeted by the attack, and detects the critical path.
A Simple Example of Calculating Attacker Interruption Probabilities
A simple example from (Bedoe, 2001): the site, shown in the figure below using the Éliette code, consists of a fence with a gate surrounding a single building. The building contains an internal room, the vital area. In this case, the path chosen by the Red Force is to cross the fence near one of the building’s entrances, run up to the gate and force it, then progress to the door of the vital area, also forcing it. Finally, the team must sabotage the installation.
The results calculated for different hypotheses by Eliette’s code are compared with the reference article and the ExcelTM sheet implementing the EASI model by APEX solutions, adapted from (Garcia, 2008). Data for the base case are summarized below.
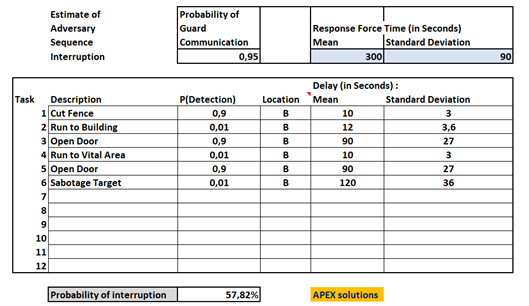
The results for the different variants are summarized in the table below.
| PI code Eliette | PI Excel APEX | PI Bedoe | |
| Basic case | 58,13% | 57,82% | 57,82% |
| Without fence detection (PD = 0,01) | 47,77% | 47,77% | 47,77% |
| Reduced response time (200 seconds) and detection on the fence | 89,70% | 89,70% | 89,70% |
| Reduced response time (200 seconds), detection on fence, and doubled sabotage delay (protection) | 94,19% | 94,19% | 94,19% |
We note a slight difference in the treatment of the base case, due to the need to make approximations of room and site dimensions (which are not provided in the literature). By adjusting slightly the travel times (proportional to the distances covered) for the base case, we get results identical to those in the literature for the three variants.
Next Steps in Intrusion Modeling Code Development
Éliette’s code will be improved to include several fences (zoning of a site), and then to handle the simultaneous movement of the blue force (the response time of the guards is fixed for now). Looking further ahead, it will be possible to individualize movements according to the role of each member of both the blue and red teams, something which has never been addressed in the literature to our knowledge. We will then move on to agent-based modeling to give the simulation more “intelligence”.
Detection probabilities, currently assigned manually to each node and arc of the graph, can be determined automatically for linear and “volumetric” (2D for now) detectors. Éliette has also begun integrating cameras in the various rooms, whose field of view is calculated automatically…
Another important step will be to simplify the retrieval of room geometry:
- first, by using an interface to simply define room boundaries on a scanned image imported in the background, as provided by the MUZO code preprocessor developed by RS2N,
- second, by using WiseBIM tools (conversion of digitized plans to IFC format) and by developing conversion tools for the objects manipulated by the code (polygons representing parts and path graphs).
References
M. L. Garcia, “Vulnerability assessment of physical protection systems”, Burlington: Elsevier Butterworth–Heinemann, 2006.
M. L. Garcia, “The Design and Evaluation of Physical Protection Systems”, Burlington: Butterworth-Heinemann, 2008.
R. Bedoe, “Part B – EASI Model”, 2001
[1] A mnemonic, completed by “green on green, all clear”, to detect the risk of collisions between two boats at night, in reference to the colors of the port and starboard signal lights…
[2] The notion of visibility graph and visibility polygon is one of the “spatial syntax” tools used in architecture and urban planning.
[3] Les différentes pièces sont représentées par des polygones.